The sonographic collection evolves like a laboratory focusing on a relation between sound and drawing. Different methods and recording systems are developed and put to test. The result is a collection of sonographic drawings. Each drawing visualizes the specific process taking place in the experiments. Specific categories label the different methods and systems that were put to test. The sonographic collection emerges with each experiment and is not meant to be completed or aiming for a certain result.
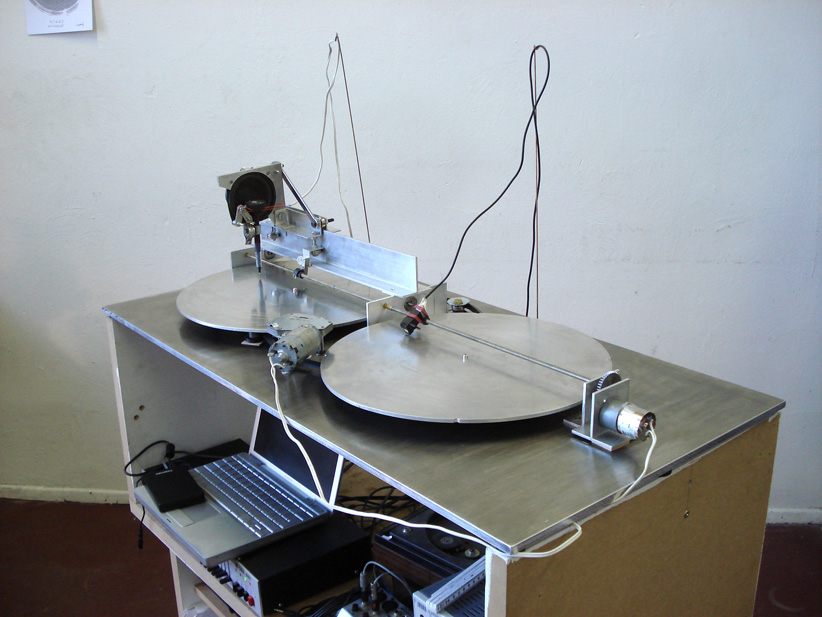
The Sonograph 2# documents measurable differences in frequency, movement and tension. Each event causes variations in the drawing process, that forms a spiral timeline. The timeline forms a 2 dimensional field, representing a lapse of time, readable as an Image.
.
acoustic map
The acoustic map category documents the specific sound environment of a field. It is recorded with a 360° Sonograph.
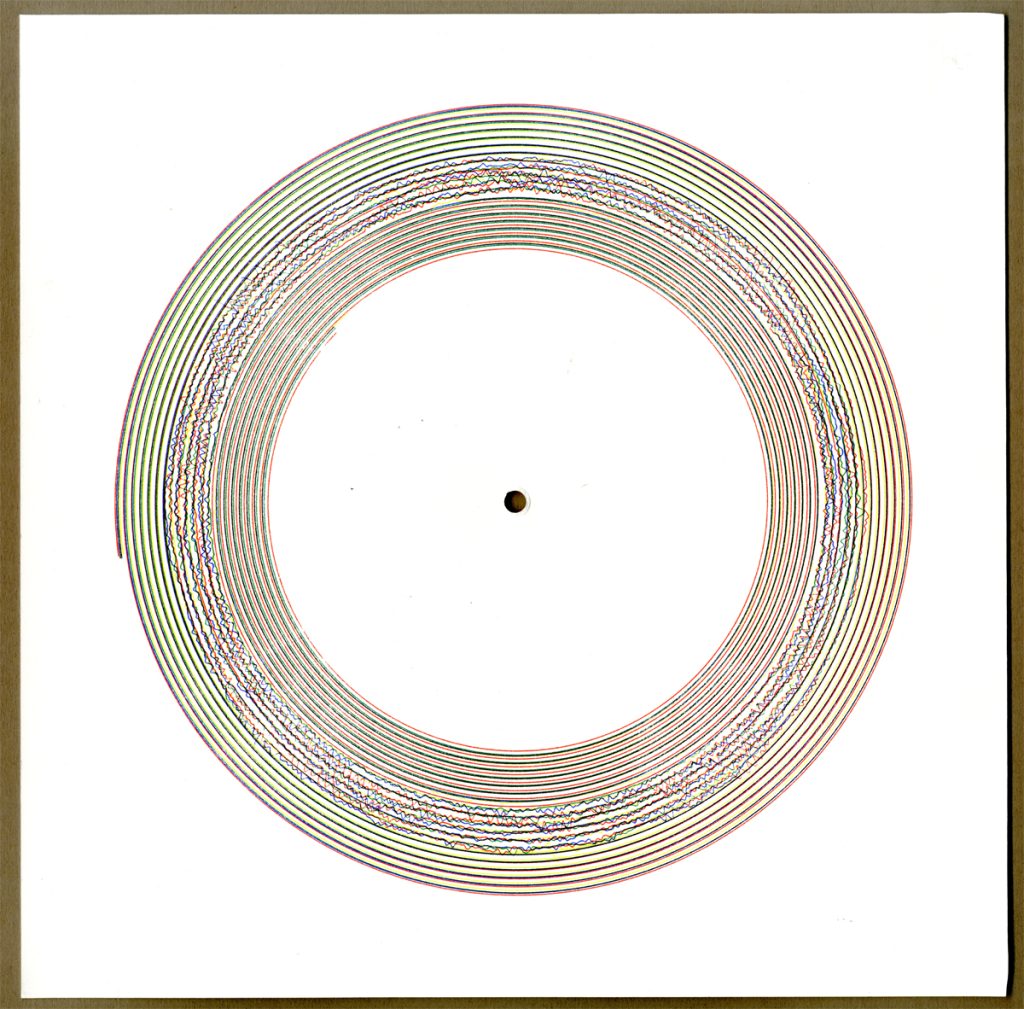
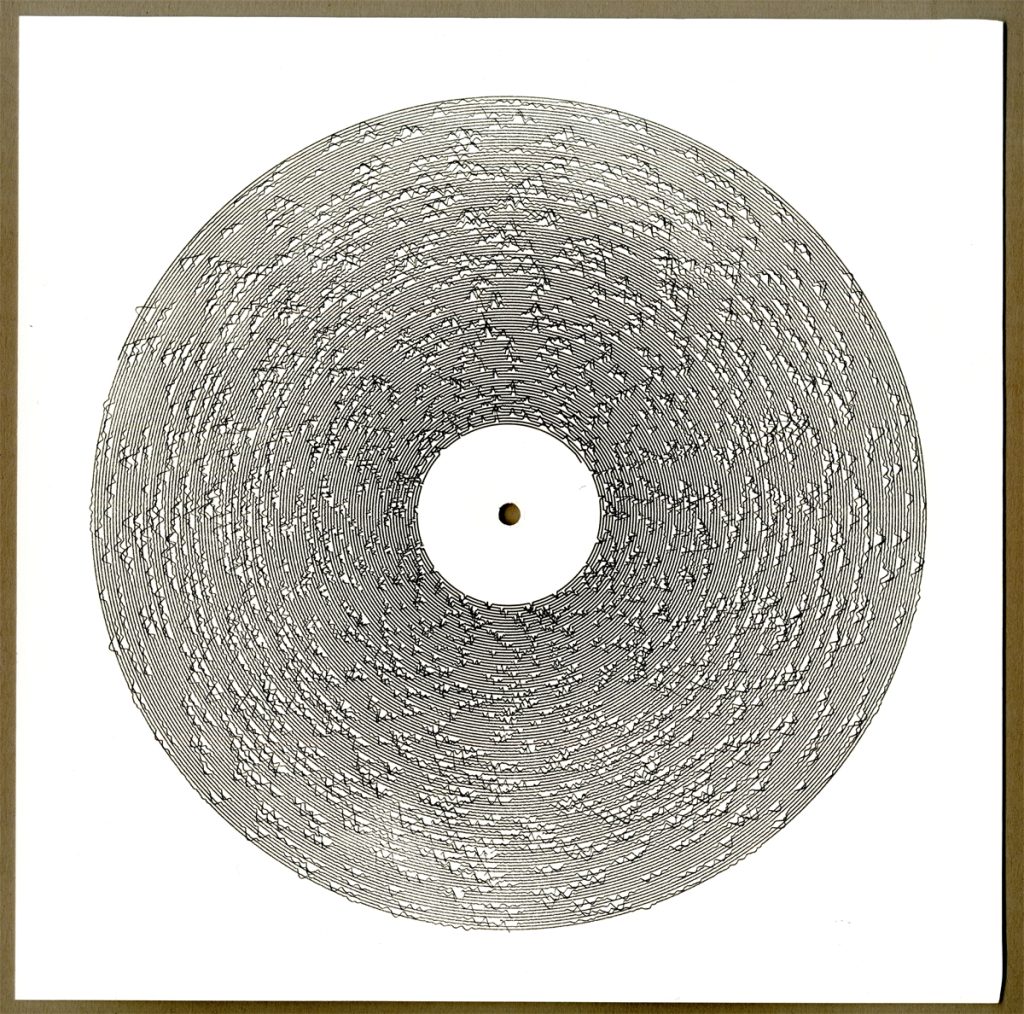
frequency mandala
A frequency mandala translates regular changes in audio frequencies into graphic patterns.

(sonography, ink on paper, 28 x 28 cm)
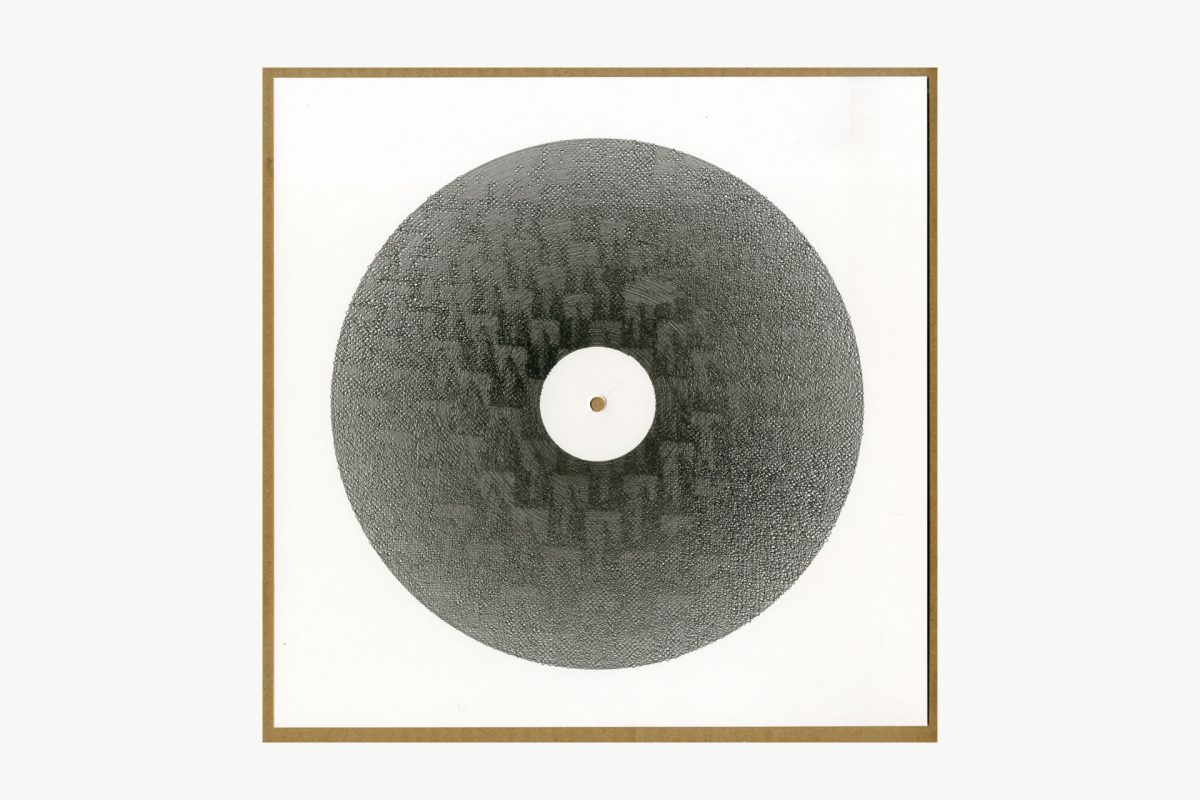
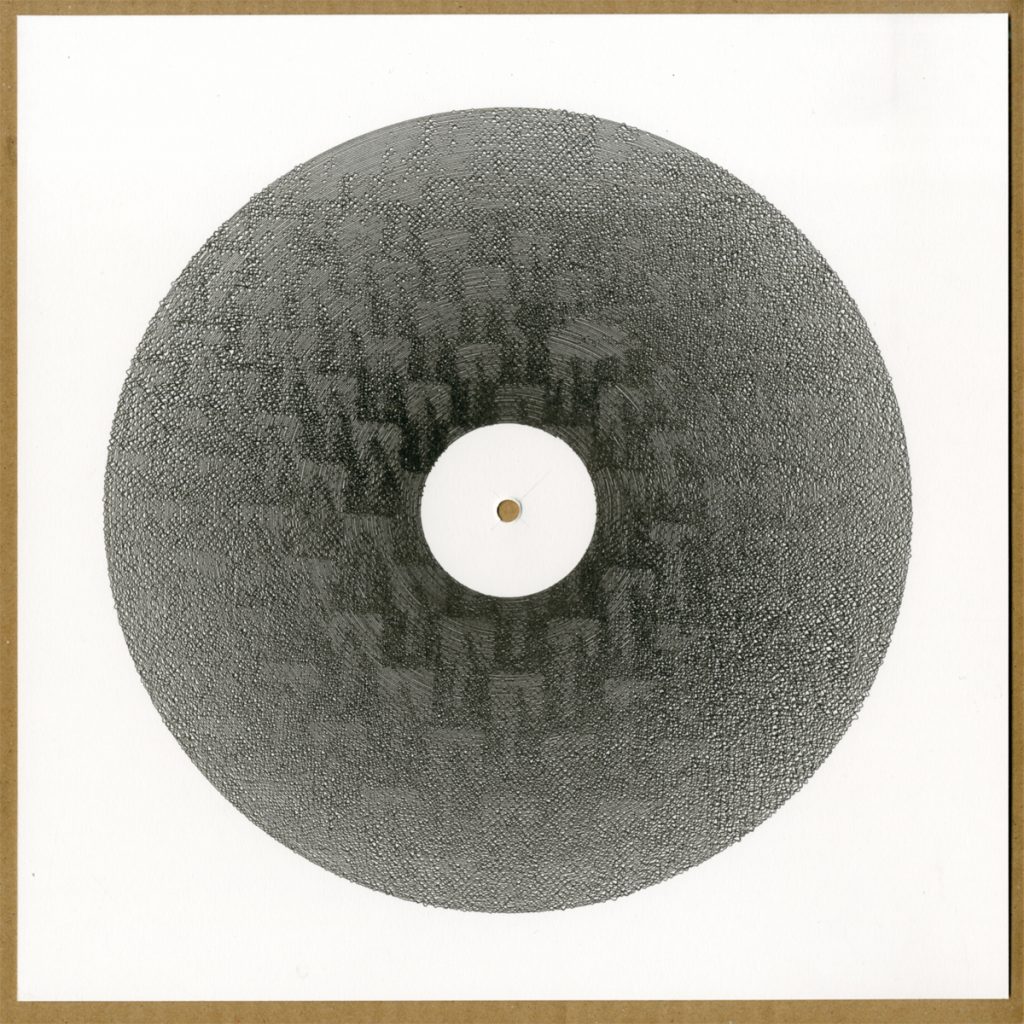
topometric chronicle
A topometric chronicle visualises the progressive change of surfaces and sounding bodies.
(sonography, ink on paper, 28 x 28 cm)
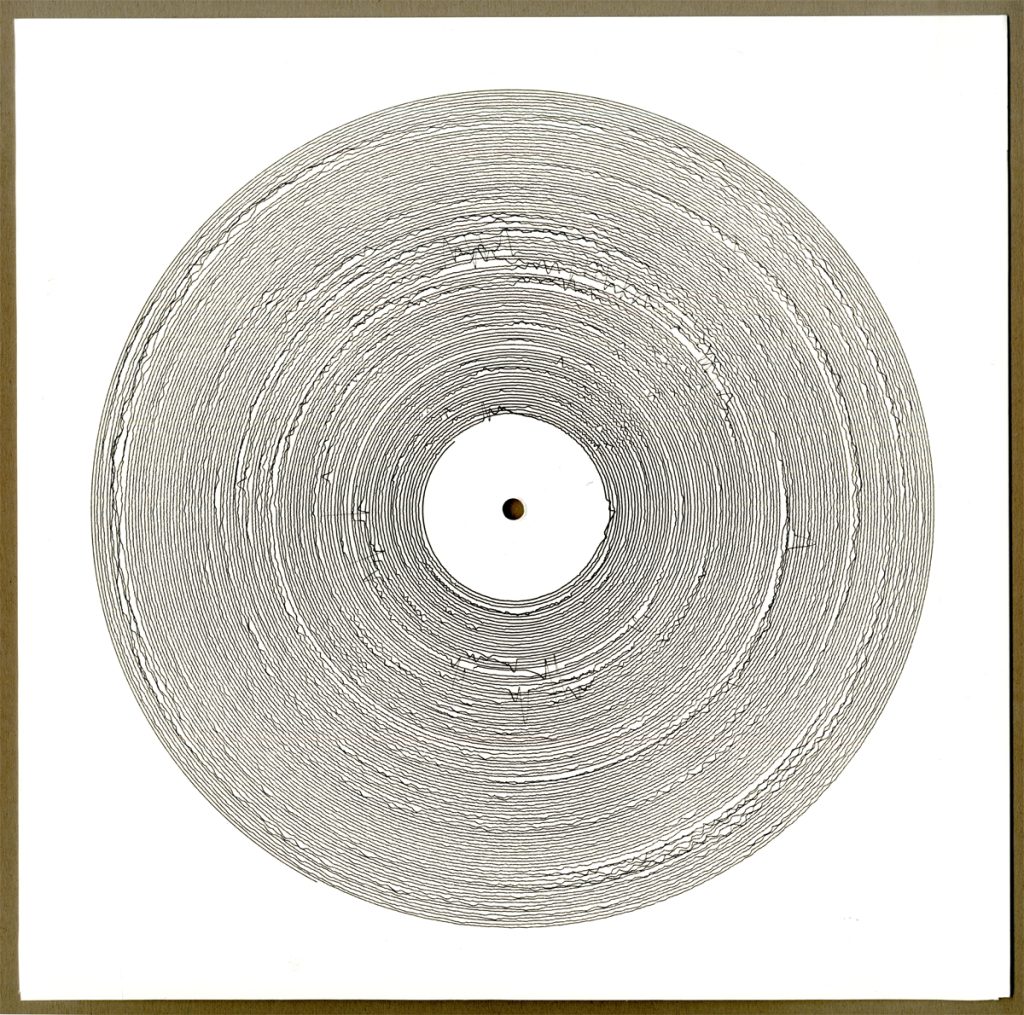
dub plates
dub plates contain visual and acoustic informations that are used for the reproduction process of an image via sound into drawing.
(sonography, ink on paper, 28 x 28 cm)
multi track
These sonographies contain several independant timelines.